Unit Resources
Statistical QuestionsStandard
Recognize a statistical question produces answers that vary. Example: “How old am I?” is not a statistical question, but “How old are the students in my school?” is a statistical question because one anticipates variability in students’ ages. Vocabulary Statistical Question -A question that anticipates variability in the data that would be collected in order to answer the question. Resources Statistical Questions Video Statistical Question Practice Measures of Center and VarianceStandard
Example Dot Plot: The dot plot shows the writing scores for a group of students on organization. Describe the data 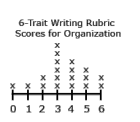
|
Display DataDot Plots
Standard:
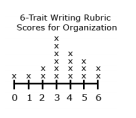
Example Dot Plot: Nineteen students completed a writing sample that was scored on organization. The scores for organization were 0, 1, 2, 2, 3, 3, 3, 3, 3, 3, 4, 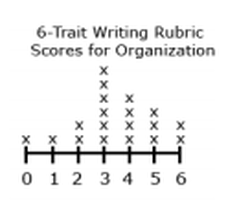
Histograms
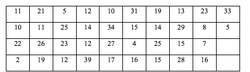
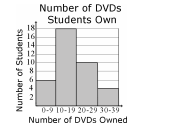
Example : Grade 6 students were collecting data for a math class project. They decided they would survey the other two grade 6 classes to determine how many DVDs each student owns. A total of 48 students were surveyed. The data are shown in the table below in no specific order. Create a data display. What are some observations that can be made from the data display? |
|
Solution: The values range from 0 – 6. There is a peak at 3. The median is 3, which means 50% of the scores are greater than or equal to 3 and 50% are less than or equal to 3. The mean is 3.68. If all students scored the same, the score would be 3.68.
Example: Consider the data shown in the dot plot of the six trait scores for organization for a group of students.
Solution:
19 students are represented in the data set. The mean of the data set is 3.5. The median is 3. The mean indicates that is the values were equally distributed, all students would score a 3.5. The median indicates that 50% of the students scored a 3 or higher; 50% of the students scored a 3 or lower. The range of the data is 6, indicating that the values vary 6 points between the lowest and highest scores. |
Solution: A histogram using 5 intervals (bins) 0-9, 10-19, …30-39) to organize the data is displayed below.
Box Plot
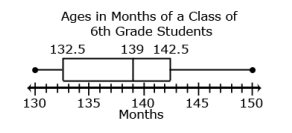
Example : Ms. Wheeler asked each student in her class to write their age in months on a sticky note. The 28 students in the class brought their sticky note to the front of the room and posted them in order on the white board. The data set is listed below in order from least to greatest. Create a data display. What are some observations that can be made from the data display? 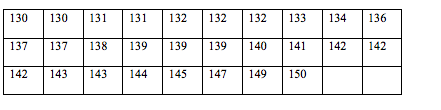
|

Solution:
The first quartile is 132.5; the third quartile is 142.5. The IQR is 10 (142.5 – 132.5). This value indicates that the values of the middle 50% of the data vary by 10. Vocabulary
Resources: IXL: DD1 - DD3 Mean, Median, Mode Video Mean, Median, Mode Practice Range Video Variance Video Summarize DataStandard
Absolute Mean Deviation (MAD) Mean Absolute Deviation (MAD) describes the variability of the data set by determining the absolute deviation (the distance) of each data piece from the mean and then finding the average of these deviations. Both the interquartile range and the Mean Absolute Deviation are represented by a single numerical value. Higher values represent a greater variability in the data. Example MAD: The following data set represents the size of 9 families: 3, 2, 4, 2, 9, 8, 2, 11, 4. What is the MAD for this data set? Solution: The mean is 5. The MAD is the average variability of the data set. To find the MAD: 1. Find the deviation from the mean. 2. Find the absolute deviation for each of the values from step 1 3. Find the average of these absolute deviations. This value indicates that on average family size varies 2.89 from the mean of 5.
Vocabulary
Resources Absolute Mean Deviation Video Absolute Mean Deviation Practice |
Solution:
Five number summary
Vocabulary
Resources IXL CC1 - CC20 Histograms video Reading Bar Graphs Video Box and Whisker Video Box and Whiskers Plot Video Box and Whisker Practice Summarize DataStandard
Example Measures of Center: Susan has four 20-point projects for math class. Susan’s scores on the first 3 projects are shown below:
Solution: One possible solution to is calculate the total number of points needed (17 x 4 or 68) to have an average of 17. She has earned 49 points on the first 3 projects, which means she needs to earn 19 points on Project 4 (68 – 49 = 19). Example Box Plot: What is the IQR of the data below: |
